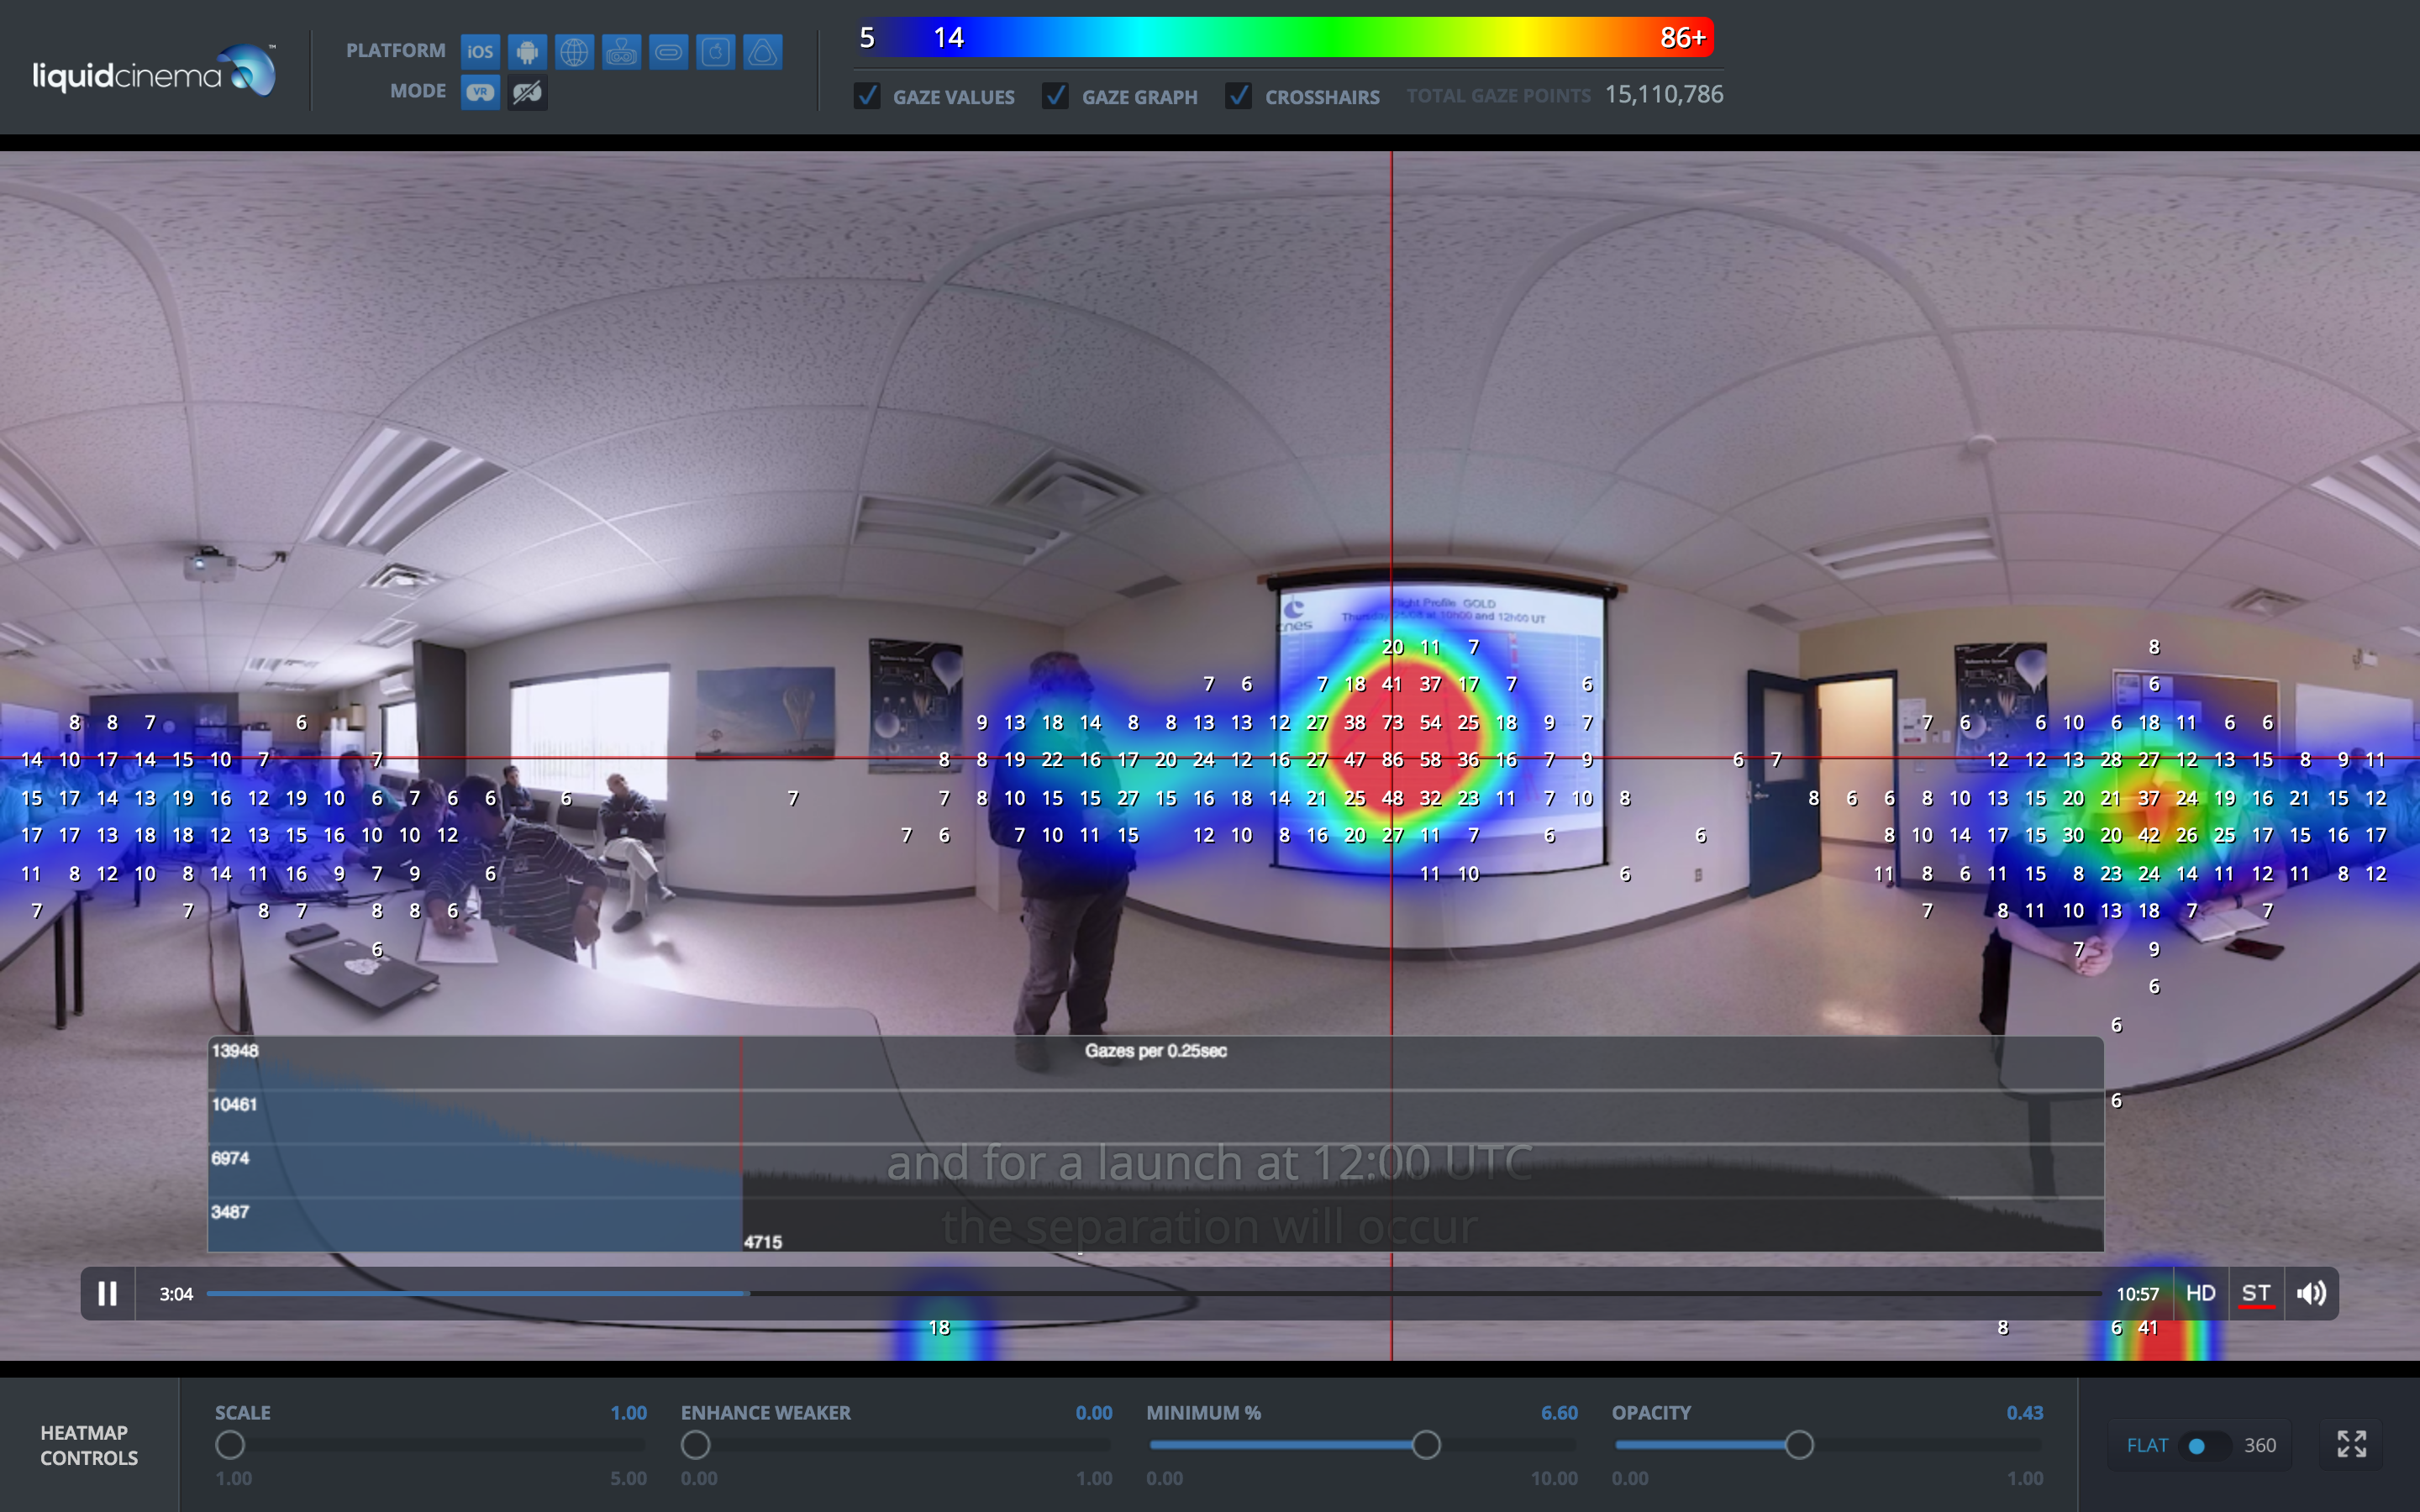
Heatmaps
All Liquid Cinema players record the viewer’s gaze four times a second. After the viewer finishes watching a video this gaze data is sent back to our servers and aggregated into a heatmap. Heatmaps are made of millions of gaze points which are constantly updated. The Heatmap Viewer that comes with the Liquid Cinema platform visualizes this data by superimposing this data on the video to see how the gazes are distributed over time. The red areas of the heatmap indicate the areas with the most gazes.
View a live heat map from our Edge of Space Project. (Produced with KonceptVR /courtesy ARTE.)
The Heatmap Viewer Interface

-
1
Platform Selector
Select for which platforms to view data.
-
2
Mode Selector
Select VR mode or non VR mode or both.
-
3
Heat Map Scale
This scale correlates the colour of the heatmap to the number of gazes.
-
4
Gaze Values
This displays the total amount of gaze points collected for this video.
-
5
Gaze Graphs
This graph shows the number of gazes over time.
-
6
Cross Hairs
Check to see crosshairs that show the dominant view (the point with the most gazes) on any given frame.
-
7
Gaze Count
Enabling Gaze Count shows the number of gazes per quadrant over the entire image.
-
8
Scale Slider
-
9
Enhance Weaker Slider
This slider makes the weaker data more visible in the heatmap.
-
10
Minimum % Slider
This slider sets the minimum number of gazes per quadrant and is useful for decluttering the heatmap of outlying values.
-
11
Opacity Slider
This slider changes the opacity of the heatmap for either better viewing of the heatmap or better viewing of the underlying video.
-
12
Flat / 360 Toggle
This toggles wether the heatmap is seen in spherical of flat mode.
-
13
Full Screen Button
This button takes the interface fullscreen.
Using Local 360 Videos
If you have the local offline video files of a project for which a heatmap exists, you can drag the project folder on top of the heatmap player for offline viewing and instant results.